Our data visualisation dashboard launches
The beta version of our interactive data visualisation dashboard app launches today!
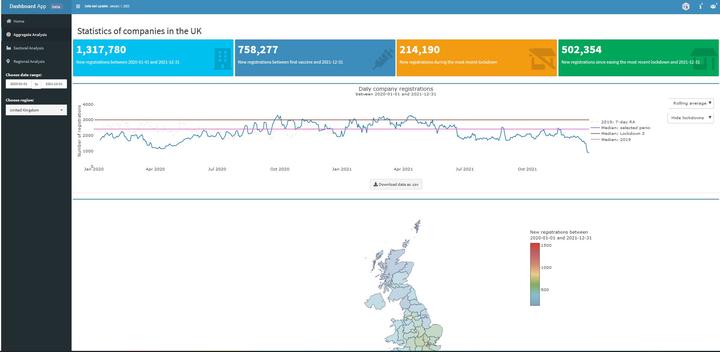
Our Team is launching today an interactive dashboard visualisation app accessible from the menu bar of our website.
Beta version
The beta version visualises all the active business incorporations based on the latest Companies House register.
Sections
The app hosts 3 main sections:
- Aggregate Analysis: daily registrations by region and sector. Explore the distribution by sector using our interactive treemap.
- Sectoral Analysis: daily registrations in multiple 1-digit (“Sections”) and 3-digits (“Groups”) SIC codes. Make comparisons across different groups within the same sectors or across different sectors.
- Regional Analysis: daily registrations within one “Group” across the different countries in the UK.
Export-the-data feature
Our dashboard app allows the user to export the data they observe in the Aggregate Analysis tab into .csv format. Future updates will include this feature to every tab.
Code
Replicable code in our repository here. Material developped using Shiny .
Access the app
Our interactive dashboard visualisation app is accessible from the menu bar of our website or here.
Yannis Galanakis
Postdoctoral Research Associate
Yannis' research interests include Labour and Applied Economics.